Automated Evaluation Job Details
Once you have successfully submitted an automated evaluation job, you will be able to review the results of the evaluation by selecting one of the jobs in the automated evaluation job list and clicking on Show Job Info.
This will launch a modal window with six tabs:
General
BLEU
Meteor
Levenshtein
Redball
TER
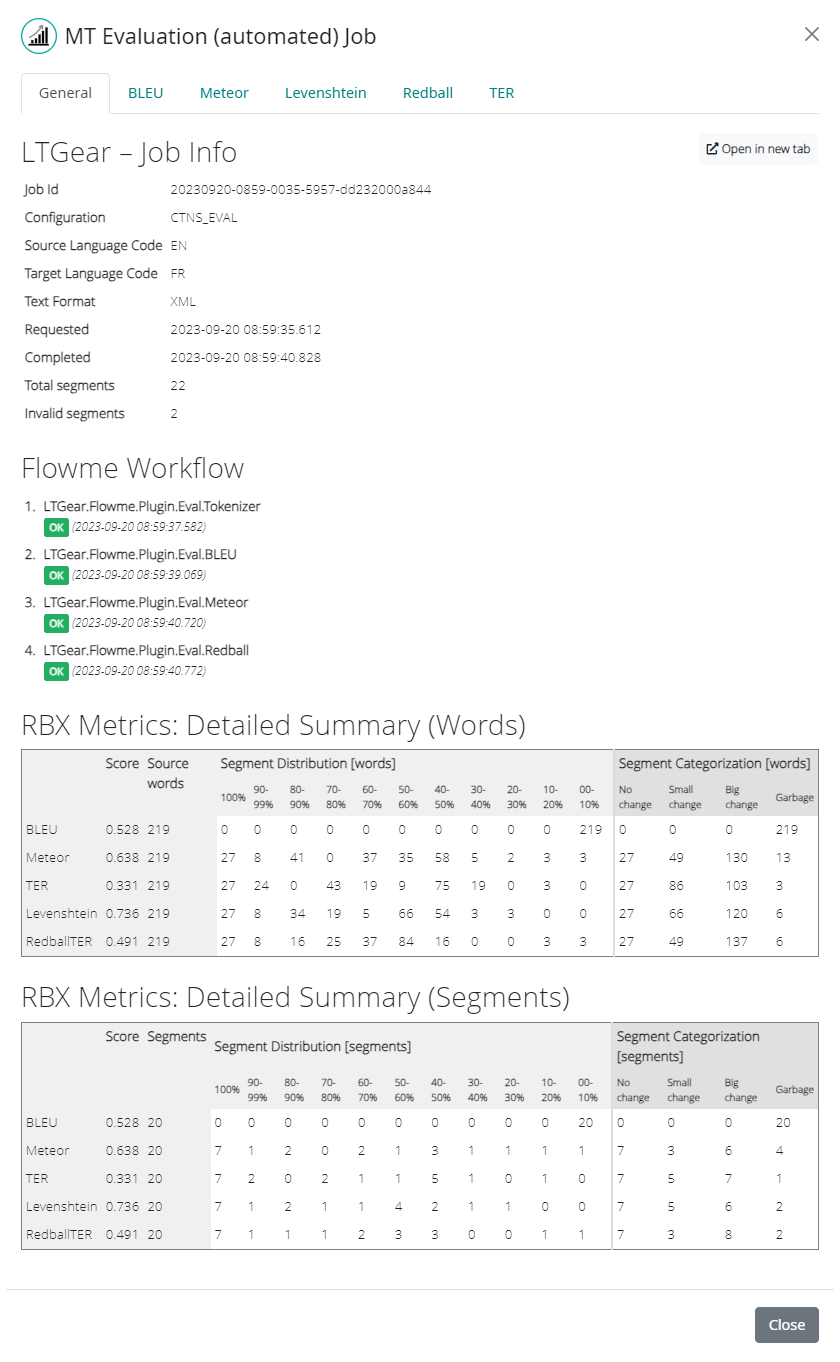
The General tab contains metadata about the completed job. This includes:
Job Id: Companion’s internal ID of the job.
Configuration: The automated evaluation configuration alias.
Source Language Code: The source language code of the job.
Target Language Code: The target language code of the job.
Text Format: The format of the submitted text (plain text or XML).
Requested: The date and timestamp of the job execution.
Completed: The date and timestamp of the job completion.
Total segments: Total number of segments included in the job.
Invalid segments: Number of segments that were invalid and therefore excluded from processing.
Flowme Workflow: Pipeline tasks executed, whether the task completed successfully, and the date and timestamp of completion.
RBX Metrics: Detailed Summary: Word or Segment-based tables contains distribution of the volume for all metrics.
The BLEU tab contains the BLEU Score metric results of the completed job. This includes the numeric result of the BLEU score metric as well as details about the configuration of the BLEU metric at runtime.
The respective metric results are displayed at the top of each of the Meteor, Levenshtein, RedBall, and TER tabs. Below that, there are four charts, providing a graphic visualization of Segment Distribution, Segment Counts per Bucket, Segment Categorization and Segment Length Analysis for each of the respective metrics.
More information about metrics (BLEU, Meteor, Levenshtein, RedBall and TER) can be found in Metrics Explained section.
Distribution chart
The Distribution chart represents the distribution of scores by number of segments (or words). This chart helps to understand the distribution of the volume of segments (or words) with better results versus those with worse results (according to the metric).
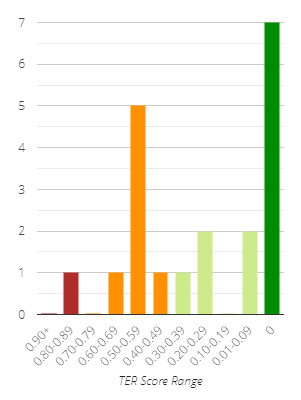
We have grouped the scores into buckets representing increasing quality (according to the metric) from left to right on the X-axis. The Y-axis shows the number of segments (or words) that fall into each of the score buckets.
By hovering over the bars of the chart with your mouse, you can display the bucket range as well as the precise number of segments/words in that bucket.
Count per Bucket chart
The Segment/Word Count per Bucket chart represents the distribution of segment length by number of segments (or words). This chart helps to understand if the content contains shorter or longer segments, which may be relevant for analysis.
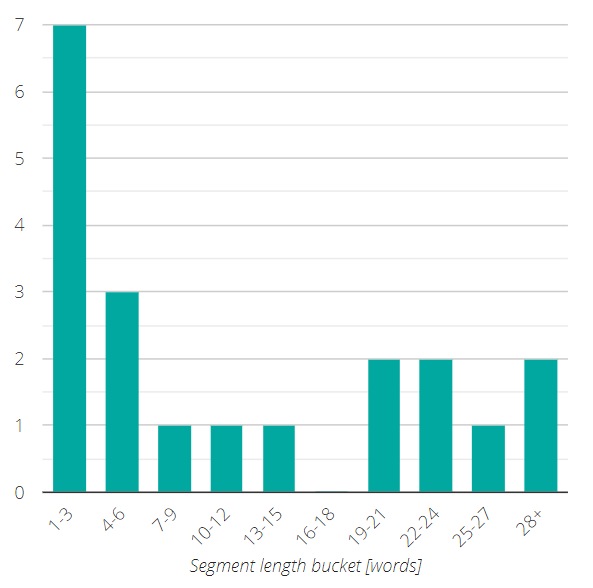
In order to make the chart more readable, we have grouped the segments into buckets of three words each, ascending from left to right on the X-axis. The Y-axis shows the number of segments (or words) that fall into each of the segment length buckets.
By hovering over the bars of the chart with your mouse, you can display the bucket range as well as the precise number of segments/words in that bucket.
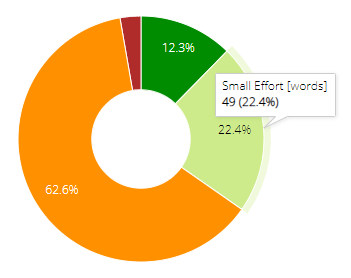
Categorization chart
The Categorization chart is a pie chart representing score categorization by metric. The chart displays the volumes (in words or segments) and percentage for each category.
The Meteor and Levenshtein metrics are MT quality metrics that estimate the machine contribution to the final output. As such, the categories describe the difference between the MT output and the human output:
No Difference - the MT and reference strings are equal.
Small Difference - there is just a small difference between MT and the reference translation.
Big Difference - there is a considerable part of the text which has been edited.
Garbage - the MT output was completely different from reference and had to be completely rewritten.
The Redball and TER metrics are metrics that estimate human contribution to the final output. Therefore, the categories used for these metrics describe the estimated effort required by the human editor to edit the string to achieve the required quality:
No Effort - the MT and reference strings are equal, requiring little to no effort from the editor.
Small Effort - there is just a small difference between MT and reference translation, requiring only a small amount of effort from the editor.
Big Effort - there is a considerable part of the text that was changed, requiring considerable effort from the editor.
Garbage - the MT output is completely different from reference translation and must be completely rewritten, at least equivalent to translating the string from scratch.
Segment Length Analysis chart
The Segment Length Analysis chart visualizes the content by segment length buckets and provides the distribution of the metric-specific categories for each bucket.
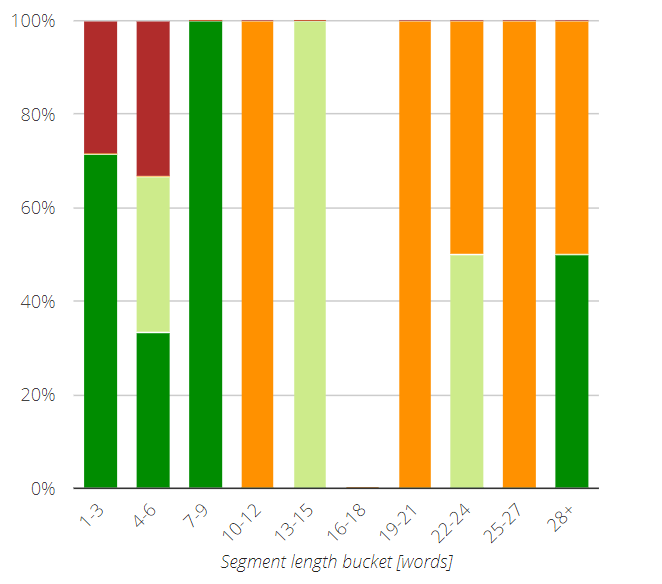
The first column on the left side of each chart represents all the segments with three or fewer words. Moving towards the right, the length of the segments represented by each column increases by three words for each successive column until the tenth column, which represents all segments containing 28 or more words. You can find the bucket range at the top row of the chart.
By hovering over the color-coded bars of the chart with your mouse, you can display the bucket range as well as the precise number of segments in that bucket and category.